

Mail reached the primary inbox more often in 2026 than in 2025, 63% of tested email against 49%, and which mailbox provider a recipient used decided more than ever where that mail landed.
That is the headline of the Unspam 2026 Email Deliverability Benchmark Report. It draws on every deliverability test and seed-mailbox placement test run through Unspam from January to September 2026, and sets each figure against the full 2025 calendar year. The Unspam Email Deliverability Benchmark is the anonymized aggregate of those tests, and its live dashboard refreshes every 24 hours.
Three findings frame the year:
- Placement improved. Primary inbox placement rose 14 points to 63%, spam fell 3 points to 33%, and checks returning a critical failure fell from 7% to 2%.
- Mailbox providers split apart. The eight-provider panel average held at 64.0% in August 2026 against 63.9% in December 2025, while the gap between the best and worst provider widened from 71.4 to 83.9 points.
- DMARC went backwards. Adoption fell from 59% to 48% of tested domains, the only authentication signal to decline.
Primary Inbox Placement Rose 14 Points to 63%
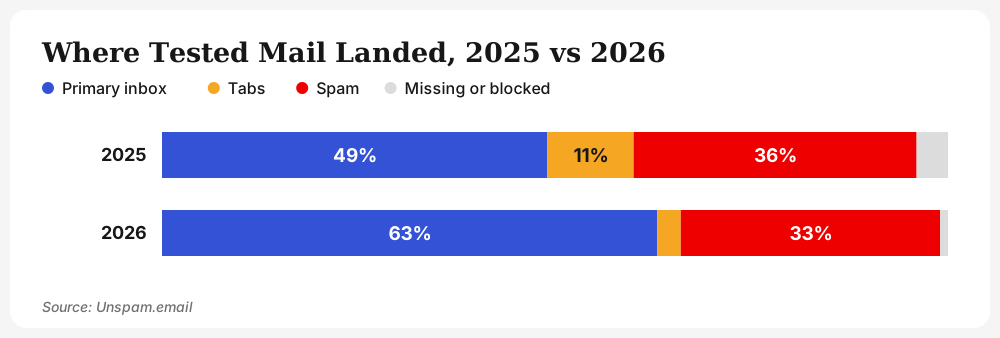
Primary inbox placement reached 63% of tested email in 2026, up from 49% in 2025, and the share sorted into tabs fell from 11% to 3%. The rows below split all tested mail by where it landed, so they add up to the whole, give or take rounding.
| Placement | 2026 | 2025 | Change |
|---|---|---|---|
| Primary inbox | 63% | 49% | +14 |
| Tabs | 3% | 11% | -8 |
| Spam | 33% | 36% | -3 |
| Missing or blocked | 1% | 4% | -3 |
| Visible mailbox (inbox plus tabs) | 66% | 60% | +6 |
Two headline measures improved alongside placement.
| Measure | 2026 | 2025 | Change |
|---|---|---|---|
| Deliverability health score, out of 100 | 88 | 83 | +5 |
| Checks returning OK | 89% | 73% | +16 |
| Checks returning a warning | 9% | 20% | -11 |
| Checks returning a critical failure | 2% | 7% | -5 |
The Unspam deliverability health score is a 0 to 100 rating of a sender’s setup that weights inbox placement at 60%, authentication at 25%, reputation at 10% and technical compliance at 5%. Warnings more than halved in 2026 and critical failures fell to under a third of the 2025 rate, so most tested senders now run close to a correct setup. The 2% still failing outright are the senders most exposed to a sudden loss of placement.
Seventeen of Twenty-One Benchmark Metrics Improved in 2026
Seventeen of the twenty-one metrics in the Unspam benchmark improved between 2025 and 2026, and four got worse: body content checks, IP blacklist exposure, short URL safety and DMARC adoption.
| Metric | 2026 | 2025 | Change |
|---|---|---|---|
| CASL compliance | 62% | 19% | +43 |
| Subject line quality | 79% | 40% | +39 |
| CAN-SPAM compliance | 35% | 3% | +32 |
| GDPR compliance | 76% | 49% | +27 |
| HTML best practices | 43% | 23% | +20 |
| Checks returning OK | 89% | 73% | +16 |
| Primary inbox placement | 63% | 49% | +14 |
| CCPA compliance | 85% | 72% | +13 |
| Domain age | 57% | 47% | +10 |
| DKIM adoption | 90% | 82% | +8 |
| SPF adoption | 93% | 86% | +7 |
| Links free of broken URLs | 80% | 74% | +6 |
| Health score, out of 100 | 88 | 83 | +5 |
| Reverse DNS | 99% | 96% | +3 |
| List-Unsubscribe header | 14% | 12% | +2 |
| Accessibility | 85% | 84% | +1 |
| BIMI record published | 1% | 0.77% | +0.23 |
| Body content analysis | 89% | 90% | -1 |
| IP blacklist clean | 94% | 98% | -4 |
| Short URL safety | 90% | 100% | -10 |
| DMARC adoption | 48% | 59% | -11 |
The four that fell carry the most risk. IP blacklist listings tripled, link shorteners came back into one tested email in ten, and DMARC, which every downstream protection depends on, lost 11 points.
The Rules Changed Before the Numbers Did
Most of what shaped deliverability in 2026 was decided before the year began, as mailbox providers moved from filtering non-compliant mail into spam to refusing it outright. What changed in email deliverability in 2026 covers every change in full. Four of them explain numbers in this report:
- Gmail escalated to SMTP rejection. In November 2025 Google began answering non-compliant bulk mail with temporary 4.7.x and then permanent 5.7.x errors instead of only filtering it, so a failed requirement increasingly shows up as a bounce rather than as spam placement.
- DMARC became RFC 9989 in May 2026. The new standard retired the pct, ri and rf tags, so a record staged at
p=reject; pct=25rejects every failing message at a receiver that follows RFC 9989. - Yahoo filters more than yahoo.com. AT&T consumer domains already run on Yahoo infrastructure and Comcast is migrating comcast.net mailboxes to Yahoo Mail, so Yahoo’s 15.3% August inbox rate reaches addresses that never say Yahoo.
- Subject lines became a legal exposure. In Brown v. Old Navy, decided April 17, 2025, the Washington Supreme Court held that a false or misleading claim in a commercial subject line violates the state’s Commercial Electronic Mail Act. Washington’s ESHB 2274, effective June 11, 2026, added a knowledge requirement.
One layer stays outside any benchmark. Filtering is turning per recipient, and an assistant that files a message into a folder generates no complaint and no unsubscribe a sender can see. A seed test measures the layer mailbox providers reject on, which is the layer that hardened in 2026. Read the attention layer from your own engagement data, split by mailbox provider.
DMARC Was the Only Authentication Signal to Fall
DMARC adoption fell from 59% of tested domains in 2025 to 48% in 2026, while SPF, DKIM and reverse DNS all rose.
| Signal | 2026 | 2025 | Change |
|---|---|---|---|
| Reverse DNS | 99% | 96% | +3 |
| SPF | 93% | 86% | +7 |
| DKIM | 90% | 82% | +8 |
| DMARC | 48% | 59% | -11 |
| BIMI | 1% | 0.77% | +0.23 |
SPF, DKIM and reverse DNS are close to their ceiling. Each gained several points in 2026, and none has much room left.
DMARC is the first authentication check that asks a sender for a decision rather than a DNS entry, because the record has to tell receivers what to do with failing mail. Fewer tested senders made that decision in 2026 than in 2025, and the gap now costs more. BIMI requires a DMARC policy of p=quarantine or stricter before a logo renders, which locks out more than half of all senders before cost comes up. RFC 9989 removed pct, so a policy staged at a percentage behaves differently at different receivers with no change to the record. The Unspam DMARC checker flags pct, ri and rf as historic tags for that reason.
IP Blacklist Listings Tripled
IP blacklist listings rose from 2% of tested senders in 2025 to 6% in 2026, while domain listings stayed rare at 0.3%.
| Check | 2026 | 2025 | Change |
|---|---|---|---|
| Domain suffix reputation | 100% | 99% | +1 |
| Domain blacklist clean | 99.7% | 99.6% | +0.1 |
| IP blacklist clean | 94% | 98% | -4 |
Domain listings barely moved while IP listings tripled, which points at shared or rented sending infrastructure rather than at the domains themselves. A single listing can take a healthy program to near-zero placement within a day.
Message Structure Improved, and List-Unsubscribe Did Not
Subject line quality rose 39 points and HTML best practices 20 points in 2026, while the List-Unsubscribe header moved 2 points, from 12% to 14% of tested email.
| Check | 2026 | 2025 | Change |
|---|---|---|---|
| Subject line quality | 79% | 40% | +39 |
| HTML best practices | 43% | 23% | +20 |
| Domain age | 57% | 47% | +10 |
| Links free of broken URLs | 80% | 74% | +6 |
| List-Unsubscribe header | 14% | 12% | +2 |
| Accessibility | 85% | 84% | +1 |
| Body content analysis | 89% | 90% | -1 |
| Short URL safety | 90% | 100% | -10 |
- HTML still fails most email. Twenty points is real progress, and at 43% most tested email still arrives with markup that risks broken rendering, failed parsing and inconsistent display, which produces the engagement signals mailbox providers punish.
- Short URLs fell further than anything else. Short URL safety dropped from a clean 100% to 90%, so one tested email in ten routes a recipient through a shortener that hides its destination from both the reader and the filter.
- List-Unsubscribe is the clearest unforced error. Google and Yahoo require the one-click header from bulk senders, it turns would-be spam complaints into clean unsubscribes, and adoption rose two points in a year. The List-Unsubscribe header guide shows the two headers it takes.
- The inbox belongs to old domains. Domains that reached the inbox in 2026 averaged 10.5 years old, up from 9.3 years in 2025, while the domain age pass rate rose ten points to 57%. Age cannot be bought quickly, which is what makes rotating sending domains expensive.
Long Subject Lines Fell to 7%
Subject lines over 60 characters fell from 10% to 7% in 2026, and the three formatting patterns tracked here added up to 12% of subject lines against 16% in 2025. In this table a lower number is the better one.
| Pattern | 2026 | 2025 | Change |
|---|---|---|---|
| Over 60 characters | 7% | 10% | -3 |
| Emoji | 3% | 4% | -1 |
| ALL CAPS | 2% | 2% | 0 |
The subject line check itself failed 21% of tested email in 2026 and 60% in 2025. The named patterns account for only a small part of that 39-point gain, so most of it came from criteria this breakdown does not show, such as misleading or spam-associated wording.
A Clean Spam Score Still Overstates Delivery by 22 Points
88% of tested emails scored under 3.0 on SpamAssassin in 2026, yet only 66% reached the inbox or a tab, a 22-point distance that measured 32 points in 2025.
| SpamAssassin band | 2026 | 2025 | Change |
|---|---|---|---|
| 0.0 to 1.0, Excellent | 47% | 47% | 0 |
| 1.1 to 3.0, Good | 41% | 45% | -4 |
| 3.1 to 5.0, Caution | 8% | 6% | +2 |
| 5.1 to 10.0, Poor | 4% | 2% | +2 |
| Above 10.0, Critical | 0.13% | Under 0.01% | +0.13 |
Four points moved out of the Good band and four points into Caution and Poor, while the top band held still, so the deterioration sits in mail that was already borderline. Treat the 22-point distance as a comparison of scale rather than a paired statistic: score bands come from every tested email and placement comes from seed mailboxes, so the two describe different samples. The direction has pointed the same way for two years. A clean SpamAssassin score keeps a sender eligible for the inbox, and it has never been what gets them delivered.
BIMI Grew and Still Covers About 1% of Senders
BIMI records appeared on about 1% of tested domains in 2026, up from 0.77% in 2025, and Verified Mark Certificates on 0.94%, up from 0.52%.
| Measure | 2026 | 2025 |
|---|---|---|
| BIMI record published | 1% | 0.77% |
| Logo displayed in a supporting client | 1% | 0.77% |
| VMC-verified logo | 0.94% | 0.52% |
A published record counts domains with a valid BIMI DNS record, and logo display counts logos that render in a supporting client; at this scale the two land on the same figure. VMC adoption grew 81% in relative terms and stays under one percent in absolute terms. Client support did not move: 72% of the email client market can render a verified logo.
The Unspam benchmark’s BIMI reference values put the payoff at 25% higher brand recognition, 18% higher open rates and 32% higher trust scores, with VMC-verified logos showing the strongest effect, and they are reference values rather than measurements from the 2026 sample. The blocker is the prerequisite chain. BIMI needs DMARC at p=quarantine or stricter, a VMC runs upward of $1,500 a year, and the logo itself needs DNS work and preparation. Gmail has honored Common Mark Certificates since September 2024, which puts a logo beside the sender name without a registered trademark, though the blue verified checkmark still requires a VMC. BIMI itself is still a draft specification, at revision 14 as of May 2026. The Unspam BIMI checker confirms whether a published record will render.
BIMI Adoption Rose in Every Industry
BIMI adoption rose in all eight industries in 2026, and it doubled or more in Financial Services, Health & Wellness and Travel & Hospitality.
| Industry | 2026 | 2025 | Change |
|---|---|---|---|
| Financial Services | 10% | 5% | +5 |
| Health & Wellness | 9% | 4% | +5 |
| Education | 11% | 7% | +4 |
| Software & Tech | 11% | 7% | +4 |
| Travel & Hospitality | 8% | 4% | +4 |
| Media & Publishing | 9% | 6% | +3 |
| Retail & E-commerce | 7% | 6% | +1 |
| Business Services | 6% | 5% | +1 |
Intent is moving faster than implementation. A sender already running DMARC at enforcement is one certificate away from a logo that 99% of senders do not display, and that advantage lasts only while adoption stays this low.
Mailbox Providers Split Further Apart
The average inbox rate across Unspam’s eight-provider panel held flat, 64.0% in August 2026 against 63.9% in December 2025, while six of the eight providers moved by more than ten points.
December 2025 and August 2026 are the one like-for-like comparison in the data, because they are the first and the latest months that carry all eight providers: ProtonMail, GMX and Amazon WorkMail joined the panel in December 2025.
| Provider | August 2026 | December 2025 | Change |
|---|---|---|---|
| Amazon WorkMail | 98.6% | 100% | -1.4 |
| ProtonMail | 97.6% | 28.6% | +69.0 |
| Zoho | 93.9% | 98.3% | -4.4 |
| GMX | 73.0% | 85.7% | -12.7 |
| Outlook | 66.8% | 41.6% | +25.2 |
| Gmail | 51.7% | 63.5% | -11.8 |
| Yahoo | 15.3% | 45.4% | -30.1 |
| AOL | 14.7% | 48.4% | -33.7 |
| Panel average | 64.0% | 63.9% | +0.1 |
| Best-to-worst gap | 83.9 points | 71.4 points | +12.5 |
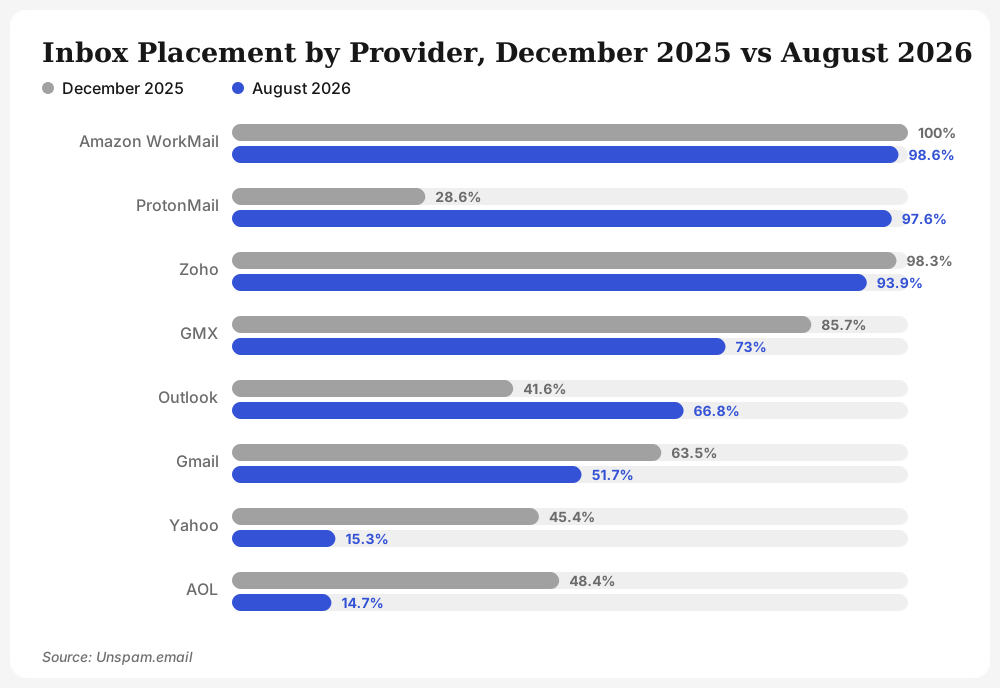
A tenth of a point separates the two panel averages while the gap between the best and worst provider grew 12.5 points, so a blended inbox rate now describes almost no individual sender’s experience.
Gmail Peaked in February, and Outlook Passed It in April
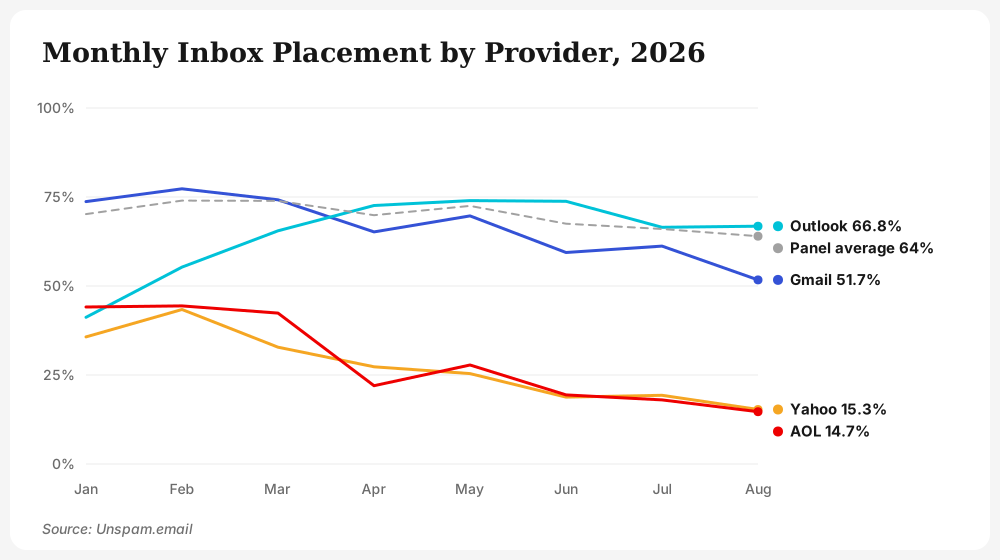
Gmail peaked at 77.3% in February 2026 and fell to 51.7% by August, while Outlook climbed from 41.2% in January, passed Gmail in April at 72.6% against 65.2%, and ended August at 66.8%.
| Month | Gmail | Outlook | Yahoo | AOL | Zoho | ProtonMail | GMX | Amazon WorkMail | Average |
|---|---|---|---|---|---|---|---|---|---|
| January 2026 | 73.7% | 41.2% | 35.7% | 44.1% | 90.0% | 96.3% | 80.5% | 100% | 70.2% |
| February 2026 | 77.3% | 55.3% | 43.4% | 44.4% | 87.7% | 100% | 84.2% | 100% | 74.0% |
| March 2026 | 74.2% | 65.5% | 32.8% | 42.4% | 89.8% | 98.9% | 87.9% | 100% | 73.9% |
| April 2026 | 65.2% | 72.6% | 27.3% | 22.0% | 91.8% | 98.7% | 81.6% | 100% | 69.9% |
| May 2026 | 69.7% | 74.0% | 25.4% | 27.8% | 98.3% | 96.5% | 88.5% | 100% | 72.5% |
| June 2026 | 59.4% | 73.8% | 18.8% | 19.4% | 95.4% | 98.4% | 75.9% | 99.3% | 67.5% |
| July 2026 | 61.2% | 66.5% | 19.3% | 18.0% | 90.5% | 97.3% | 76.4% | 98.8% | 66.0% |
| August 2026 | 51.7% | 66.8% | 15.3% | 14.7% | 93.9% | 97.6% | 73.0% | 98.6% | 64.0% |
- Gmail repeated its 2025 shape. It peaked early and slid for months, from 77.3% in February to 51.7% in August, just as 2025 ran from an 87.5% peak in May to 63.5% in December. Two years of the same curve are consistent with Gmail weighting sustained engagement progressively harder, though placement data shows the pattern rather than the algorithm.
- Outlook reversed. Outlook ended 2025 at 41.6%, reached 74.0% in May 2026 and settled at 66.8% in August. Either senders met thresholds that stayed put, or the senders who could not were rejected at SMTP instead of filtered, which removes them from placement figures, and placement data alone cannot separate the two.
- Yahoo and AOL collapsed together. They fell 30.1 and 33.7 points from December 2025, run on shared filtering infrastructure, and their monthly rates in 2026 correlate at 0.94. Yahoo averaged 27.2% across the eight months, the lowest of any provider, and AOL closed August lower still at 14.7%. Treat them as one provider. List hygiene is where we would start, though nothing in the data isolates which lever moves them.
- Business and privacy providers stayed high. Amazon WorkMail, ProtonMail and Zoho all placed above 93% in August and above 87% in every month of 2026, and B2B senders should know that this stability flatters a blended average.
88% of Gmail Inbox Mail Reached Primary
Once tested mail reaches the Gmail inbox, 88% of it lands in Primary, up from 82% in 2025.
| Tab | 2026 | 2025 | Change |
|---|---|---|---|
| Primary | 88% | 82% | +6 |
| Updates | 8% | 14% | -6 |
| Forums | 3% | Not tracked | New |
| Promotions | 1% | 4% | -3 |
Reaching Gmail is the hard part, and once there almost nine tenths of tested mail reaches Primary. Read the Primary gain with care: Gmail reported three tabs in 2025 and four in 2026, so the six points are measured against a different split.
Every Industry Improved, and Health Scores Explain Little
Inbox placement rose in all eight industries in 2026, and the industry average climbed from 60.4% to 68.0%.
| Industry | 2026 | 2025 | Change |
|---|---|---|---|
| Education | 75% | 61% | +14 |
| Health & Wellness | 71% | 62% | +9 |
| Travel & Hospitality | 70% | 68% | +2 |
| Software & Tech | 69% | 58% | +11 |
| Business Services | 67% | 56% | +11 |
| Financial Services | 65% | 57% | +8 |
| Media & Publishing | 64% | 59% | +5 |
| Retail & E-commerce | 63% | 62% | +1 |
| Average | 68.0% | 60.4% | +7.6 |
- Education gained the most and now leads. Fourteen points took it from fourth of eight in 2025 to the top. Nothing in the data explains the jump, and the obvious candidate is an audience that expects the mail and addresses that stay active for years.
- Retail and e-commerce barely moved. One point, against an average that rose 7.6, dropped it from joint second in 2025 to last. High frequency, promotional cadence and large aged lists are the usual causes, and better HTML fixes none of them.
Industry Health Scores Barely Track Inbox Placement
The average deliverability health score rose in every industry in 2026, and the ranking barely tracks inbox placement. Rows follow the 2026 inbox placement ranking, from Education at 75% down to Retail & E-commerce at 63%.
| Industry | 2026 | 2025 | Change |
|---|---|---|---|
| Education | 89.5 | 83.5 | +6.0 |
| Health & Wellness | 89.2 | 83.5 | +5.7 |
| Travel & Hospitality | 87.2 | 83.0 | +4.2 |
| Software & Tech | 89.6 | 83.5 | +6.1 |
| Business Services | 89.9 | 83.7 | +6.2 |
| Financial Services | 88.0 | 83.8 | +4.2 |
| Media & Publishing | 88.4 | 83.6 | +4.8 |
| Retail & E-commerce | 88.9 | 83.7 | +5.2 |
Read in inbox order, the scores scramble: 89.5, 89.2, 87.2, 89.6, 89.9, 88.0, 88.4, 88.9. The spread across the eight sectors widened from 0.8 points in 2025 to 2.7 in 2026. Travel & Hospitality sits last on health score and third on inbox rate, Business Services leads on health score and places fifth, and Retail & E-commerce raised its score 5.2 points and its inbox rate 1 point. A checklist-clean setup prevents a specific set of failures and predicts almost nothing about arrival. Our read is that audience relationship and sending consistency, not a better score, separate the top of the inbox table from the bottom.
Compliance Moved Faster Than Any Technical Metric
Every regulation the benchmark tracks improved in 2026, and CASL compliance rose 43 points, the largest single-year gain anywhere in the report.
| Regulation | 2026 | 2025 | Change |
|---|---|---|---|
| CASL | 62% | 19% | +43 |
| CAN-SPAM | 35% | 3% | +32 |
| GDPR | 76% | 49% | +27 |
| CCPA | 85% | 72% | +13 |
- CASL rose furthest. Canada’s law requires express consent rather than the implied consent most list building assumes, and four tested senders in five failed it in 2025 against about two in five in 2026.
- CAN-SPAM rose almost twelvefold. Part of the jump is mechanical: honest subject lines are one of the law’s requirements, and subject line quality rose 39 points over the same period. The timing also matches Brown v. Old Navy, decided in April 2025, which put a price on misleading subject lines in Washington.
- CAN-SPAM still trails the next-lowest regulation by 27 points. At 35%, two tested emails in three miss at least one of its requirements, which makes the footer, where the unsubscribe link and sender identification live, the first place to look.
Mailbox providers do not read statutes, but they measure the behaviors these laws require: identifiable senders, honest subject lines and an easy way out. Those measurements feed sender reputation directly.
What to Fix in 2027
Report by mailbox provider first, because an 83.9-point gap between the best and worst provider makes a blended inbox rate close to meaningless. The six priorities, in order:
- Report and act by mailbox provider. Split Gmail, Yahoo and AOL, Outlook, and everything else, and manage them as separate programs with separate cadences.
- Rescue Yahoo and AOL with suppression. Both sit below 16% after falling more than 30 points. Cut non-openers hard, rebuild slowly and measure weekly, and remember that AT&T and migrated Comcast addresses sit behind the same filters.
- Take DMARC to enforcement. It was the only authentication signal to fall, and it gates BIMI and every other protection downstream. RFC 9989 removed pct, so a staged rollout behaves inconsistently across receivers until you commit to a full policy.
- Fix the footer. CAN-SPAM compliance rose 32 points while List-Unsubscribe moved 2. At 14%, the one-click header is still the cheapest unclaimed gain in the benchmark.
- Audit IP reputation and remove link shorteners. IP listings tripled and short URL safety fell 10 points, and both are infrastructure decisions that someone has to own outside the campaign calendar.
- Optimize consistency, not content. 89% of tested email passes body content checks and 88% scores under 3.0 on SpamAssassin. Steady volume, steady cadence, clean lists and an established domain matter more now than another content pass.
The senders who did well in 2026 were the ones whose sending looked the same in August as it did in January.
Run the Same Checks on Your Own Mail
Every figure in the Unspam 2026 Email Deliverability Benchmark Report comes from checks any sender can run on their own email.
- Spam test and deliverability score: authentication, reputation, blacklists, content, links and structure, scored 0 to 100 with each failed check explained.
- Inbox placement test: seed mailboxes across consumer and business providers report the actual folder, whether primary, tabs or spam.
- Email preview: rendering across email clients and devices in light and dark mode, where a broken layout gets caught while it is still fixable.
- Deliverability monitoring: scheduled tests with alerts when placement or score slips, so an incident like the late-February 2026 Outlook.com rejections shows up in the next scheduled test instead of the next campaign report.
- APIs and an MCP server: the spam checker API, the inbox placement API and an email MCP server put the same checks inside your own stack and your AI assistants.
For hands-on help with reputation recovery, warm-up or provider-specific filtering, Unspam’s email deliverability consultants work from the same data.
Methodology and How to Cite This Report
The Unspam 2026 Email Deliverability Benchmark Report aggregates anonymized deliverability checks run through Unspam, the same data the live benchmark refreshes every 24 hours.
- Windows: 2026 figures cover January to September 2026, and 2025 figures cover the full 2025 calendar year.
- Placement: seed mailboxes at eight providers, across consumer and business inboxes: Gmail, Outlook, Yahoo, AOL, Zoho, ProtonMail, GMX and Amazon WorkMail. Monthly and panel figures are the rate for each calendar month.
- Sample: figures reflect senders who tested with Unspam, so they skew toward senders actively diagnosing a deliverability issue and do not represent all email worldwide.
- Restated 2025 figures: the 2025 column is calendar-year 2025 as the benchmark reports it in September 2026, and several values differ from the 2025 edition of this report, published in January 2026. That edition reported 66% of mail reaching a visible mailbox, where the benchmark now reports 60% for 2025.
Cite this report as: Unspam Email Deliverability Benchmark Report 2026, unspam.email/email-deliverability-benchmark, figures for January to September 2026.
The 2025 edition of the report is still available as a video walkthrough and a PDF.
Press play to load this video from YouTube (Google). See our cookie policy.
