

Here’s a number that should bother you: 34% of emails land in spam.
Not 5%. Not 10%. A full third. That’s from our own data, aggregated from thousands of daily deliverability tests across every major provider and industry. It’s happening right now, in 2026, at a time when sender authentication is at an all-time high.
To put that in context: roughly 392.5 billion emails are sent and received every day worldwide in 2026, according to the Radicati Group. Nearly 48% of that volume is spam. That’s about 188 billion junk emails per day. The inbox has never been more crowded, and the filters have never been stricter.
We run the Unspam.email Deliverability Benchmark, which updates every 24 hours with real inbox placement data, authentication adoption rates, SpamAssassin scores, and content quality checks from millions of tests worldwide. Most deliverability reports are annual snapshots. Ours is a living dataset.
This article breaks down what we’re seeing in 2026. Some of the numbers are encouraging. Others are genuinely alarming. All of them are real.
The Big Picture: 87/100 Health Score, 59% Inbox Rate
The global deliverability health score sits at 87 out of 100. That sounds great. Excellent, technically.
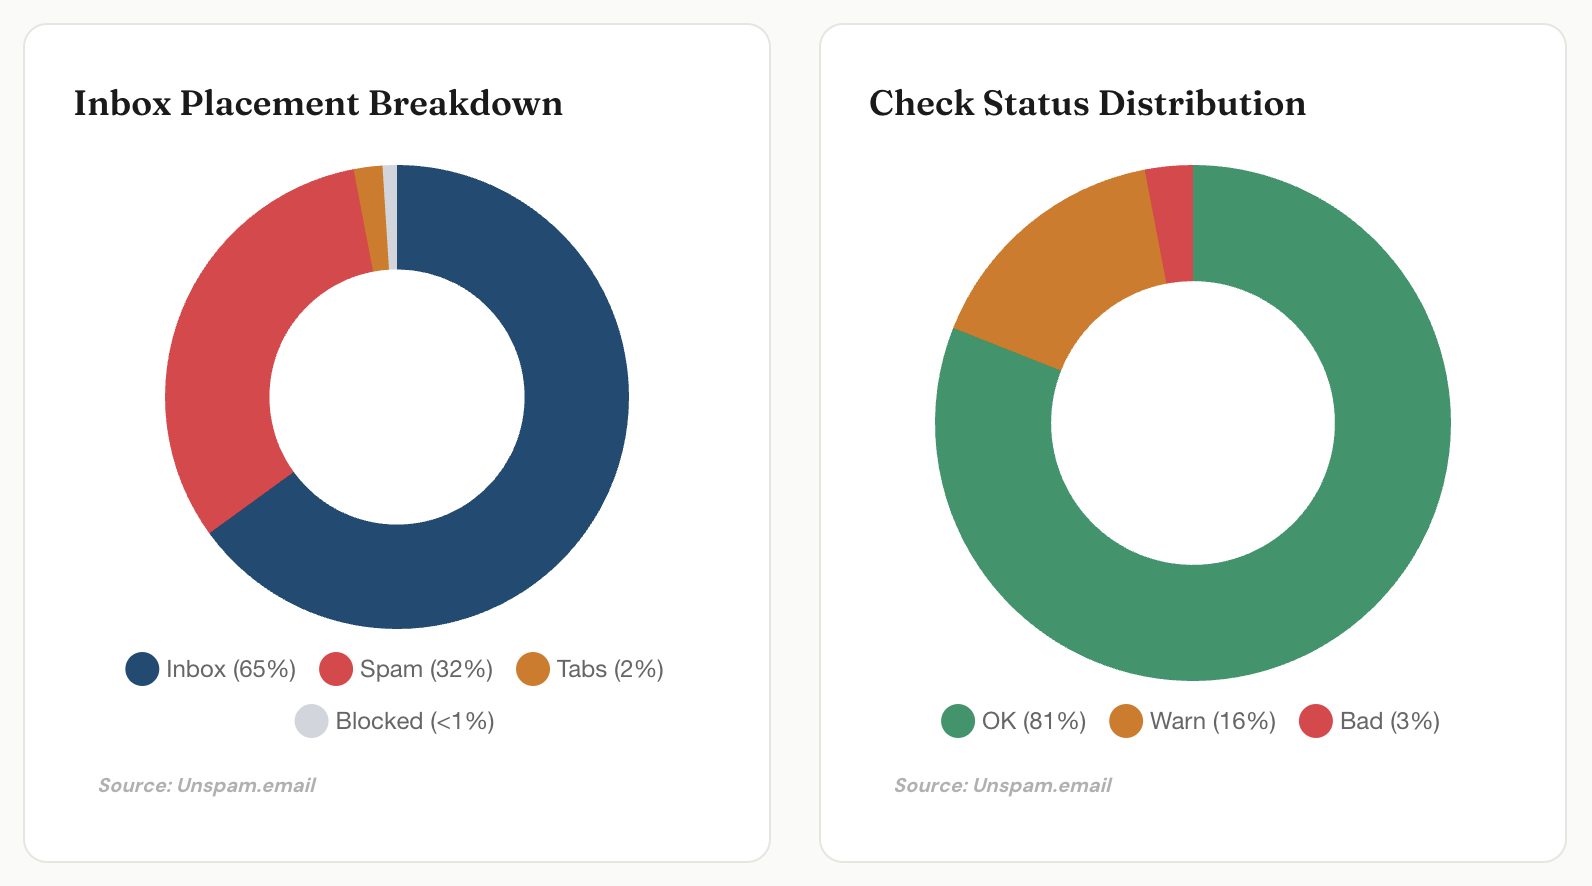
But the inbox placement rate tells a different story. Only 59% of tested emails reach the actual inbox. Another 34% go straight to spam. About 7% get sorted into tabs (Promotions, Updates), and effectively none get blocked entirely.
Across all our checks, 82% come back clean, 14% trigger warnings, and 4% flag as critical failures. That 4% sounds small until you realize each email goes through 16+ discrete checks. One bad result can tip you into spam.
How can you have an “Excellent” health score and still lose a third of your emails to spam? Because the health score measures your setup (authentication, infrastructure, reputation) while inbox placement depends on a much larger set of variables: content quality, engagement history, and ISP-specific algorithms that change constantly. You can do everything right on the technical side and still get filtered.
For comparison, Validity’s 2025 benchmark report found that global inbox placement declined throughout 2024. EmailToolTester’s independent testing puts the industry-wide average at around 83.1%.
Our number is lower (59%) because we test across a broader range of senders, including cold outreach and transactional emails, not just established marketing programs. The discrepancy itself tells a story: your deliverability experience depends heavily on what kind of email you’re sending and how long you’ve been sending it.
Across all our checks, 82% come back clean, 14% trigger warnings, and 4% flag as critical failures. That 4% sounds small until you realize each email goes through 16+ discrete checks. One bad result can tip you into spam.
How We Calculate the Health Score
Inbox Placement Rates (60%) + Authentication Setup (25%) + Reputation Metrics (10%) + Technical Compliance (5%). Scores 85 to 100 = Excellent. 70 to 84 = Good. Below 70 = Needs Attention.
Where Your Emails Actually Land (by Provider)
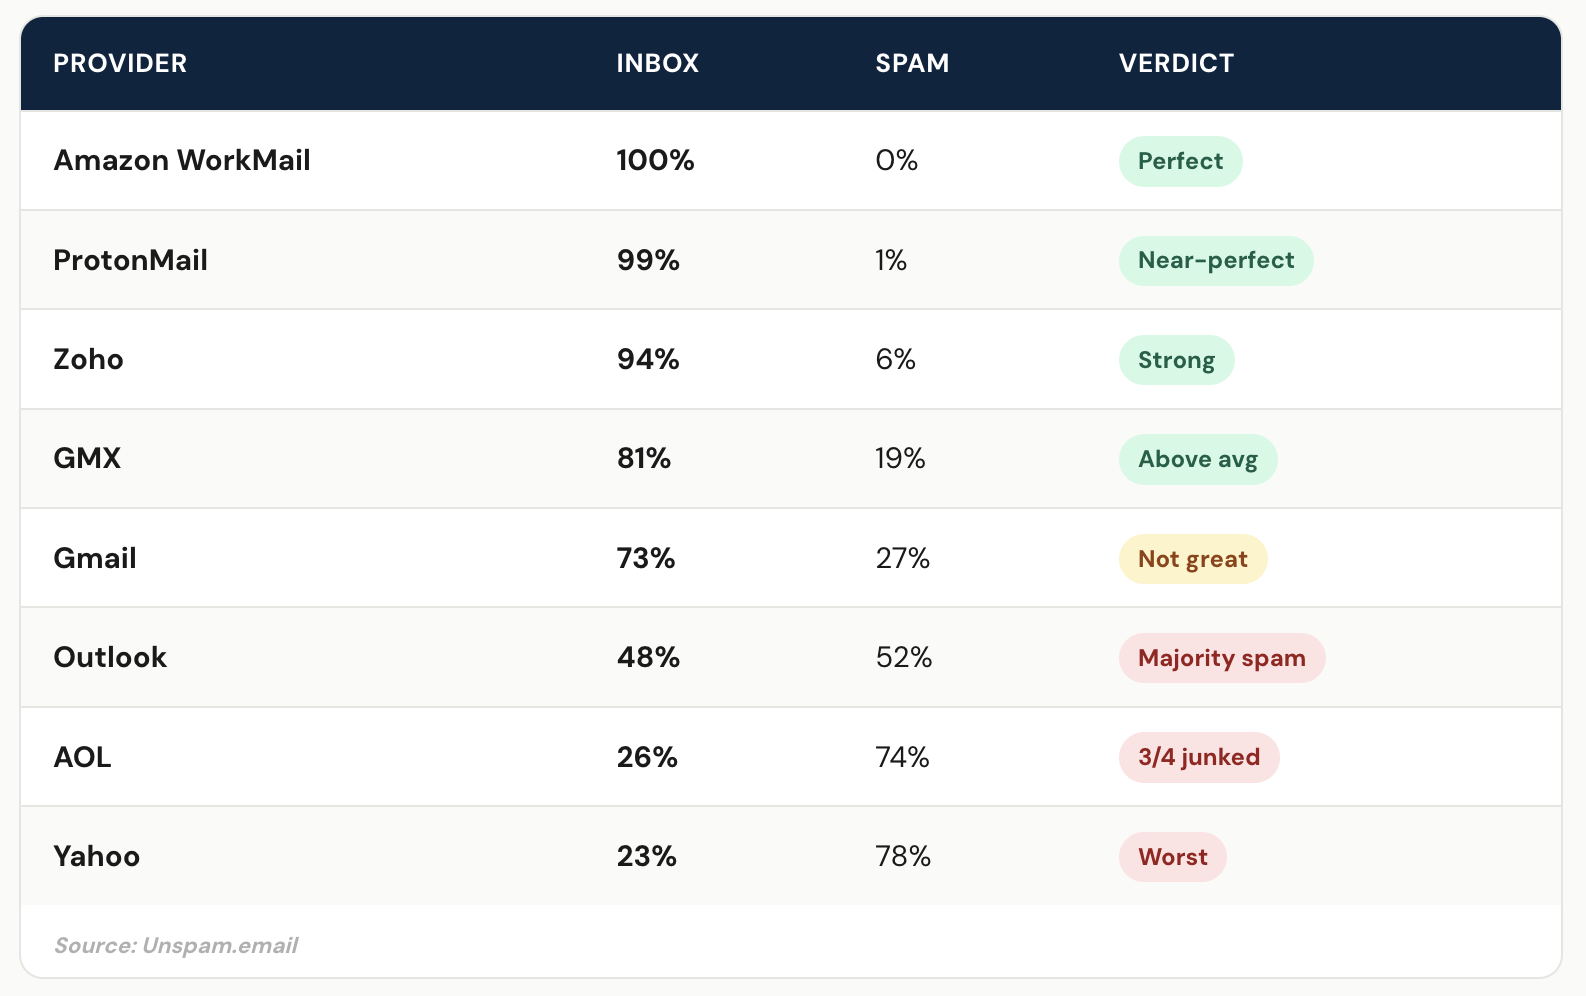
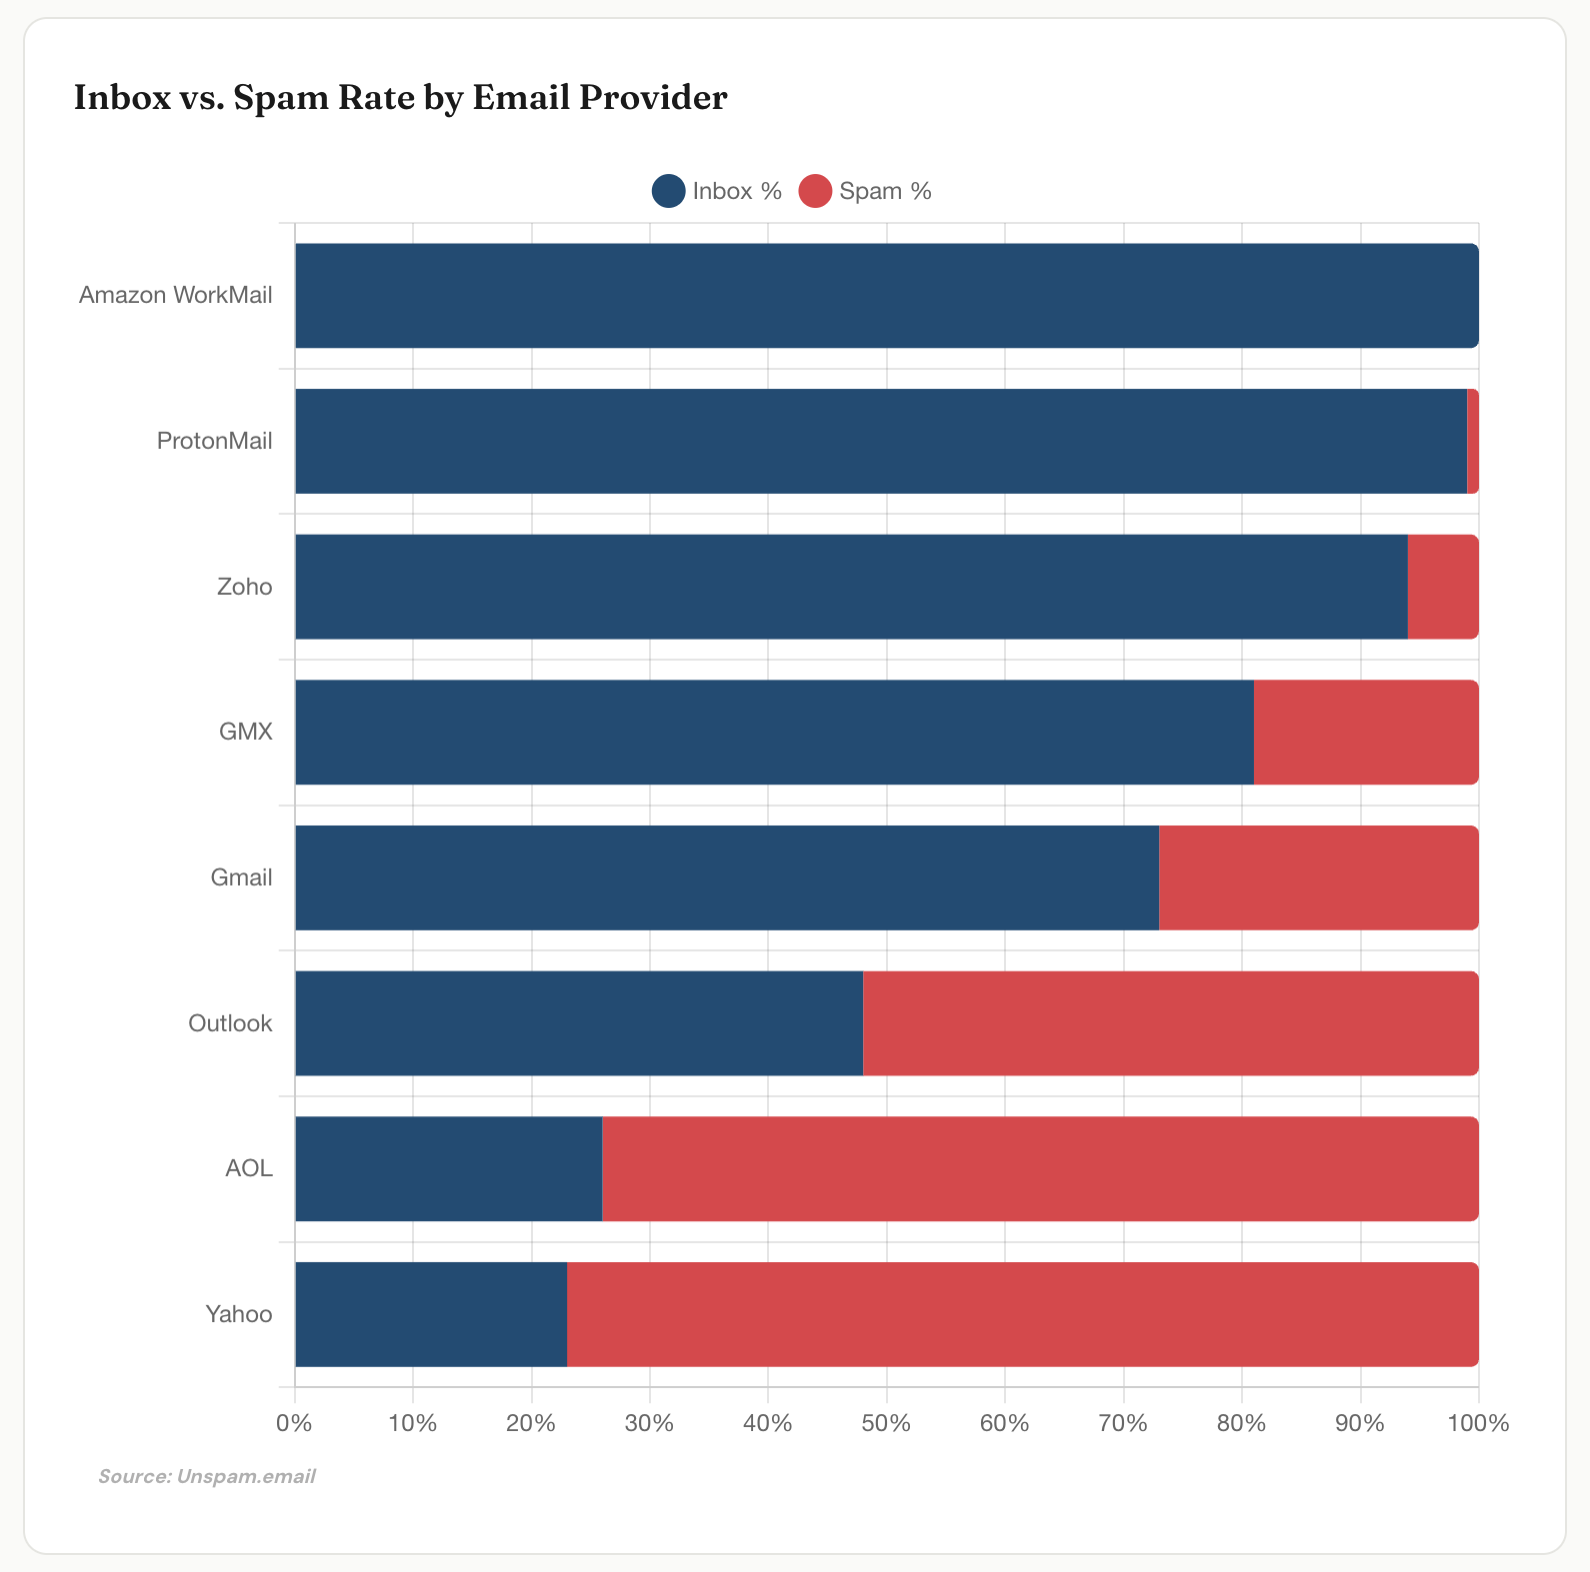
This is probably the most useful table in the entire article. The inbox experience your subscribers have depends enormously on which provider they use.
| Provider | Inbox Rate | Spam Rate | The Reality |
|---|---|---|---|
| Amazon WorkMail | 100% | 0% | Perfect. Every email lands. |
| ProtonMail | 95% | 5% | Near-perfect. |
| Zoho | 93% | 7% | Strong performance. |
| GMX | 83% | 17% | Good. Above global average. |
| Gmail | 68% | 32% | 32% hits spam. Not great. |
| Outlook | 48% | 52% | More spam than inbox. |
| AOL | 42% | 58% | Most emails miss the inbox. |
| Yahoo | 40% | 60% | Worst performer by far. |
Read that again. Yahoo lets only ~40% of tested emails reach the inbox: about 60% go to spam. Outlook sends the majority to junk. Even Gmail, the provider most senders optimize for, spams 32% of emails.
Gmail controls roughly 72% of the consumer email market share globally, with over 1.8 billion active users. That means the 32% spam rate at Gmail alone affects a staggering number of emails. And Gmail isn’t even the hardest provider to reach. Microsoft’s Outlook, which Validity’s data places at around 75.6% inbox in optimized conditions, drops to 48% in our broader testing.
The spread from top to bottom is 60 percentage points. If a big chunk of your audience uses Outlook or Yahoo, you have a specific, provider-level problem that won’t show up in your overall metrics unless you segment by ISP.
Gmail Tab Distribution
Among emails that reach Gmail’s inbox (68%), the vast majority land in Primary (82%). Updates captures 14%, Promotions 3%, and Forums just 1%. The tab problem is mostly a myth at this point. The real battle is getting past the spam filter.
Email Authentication Statistics: Record Highs, Still Not Enough
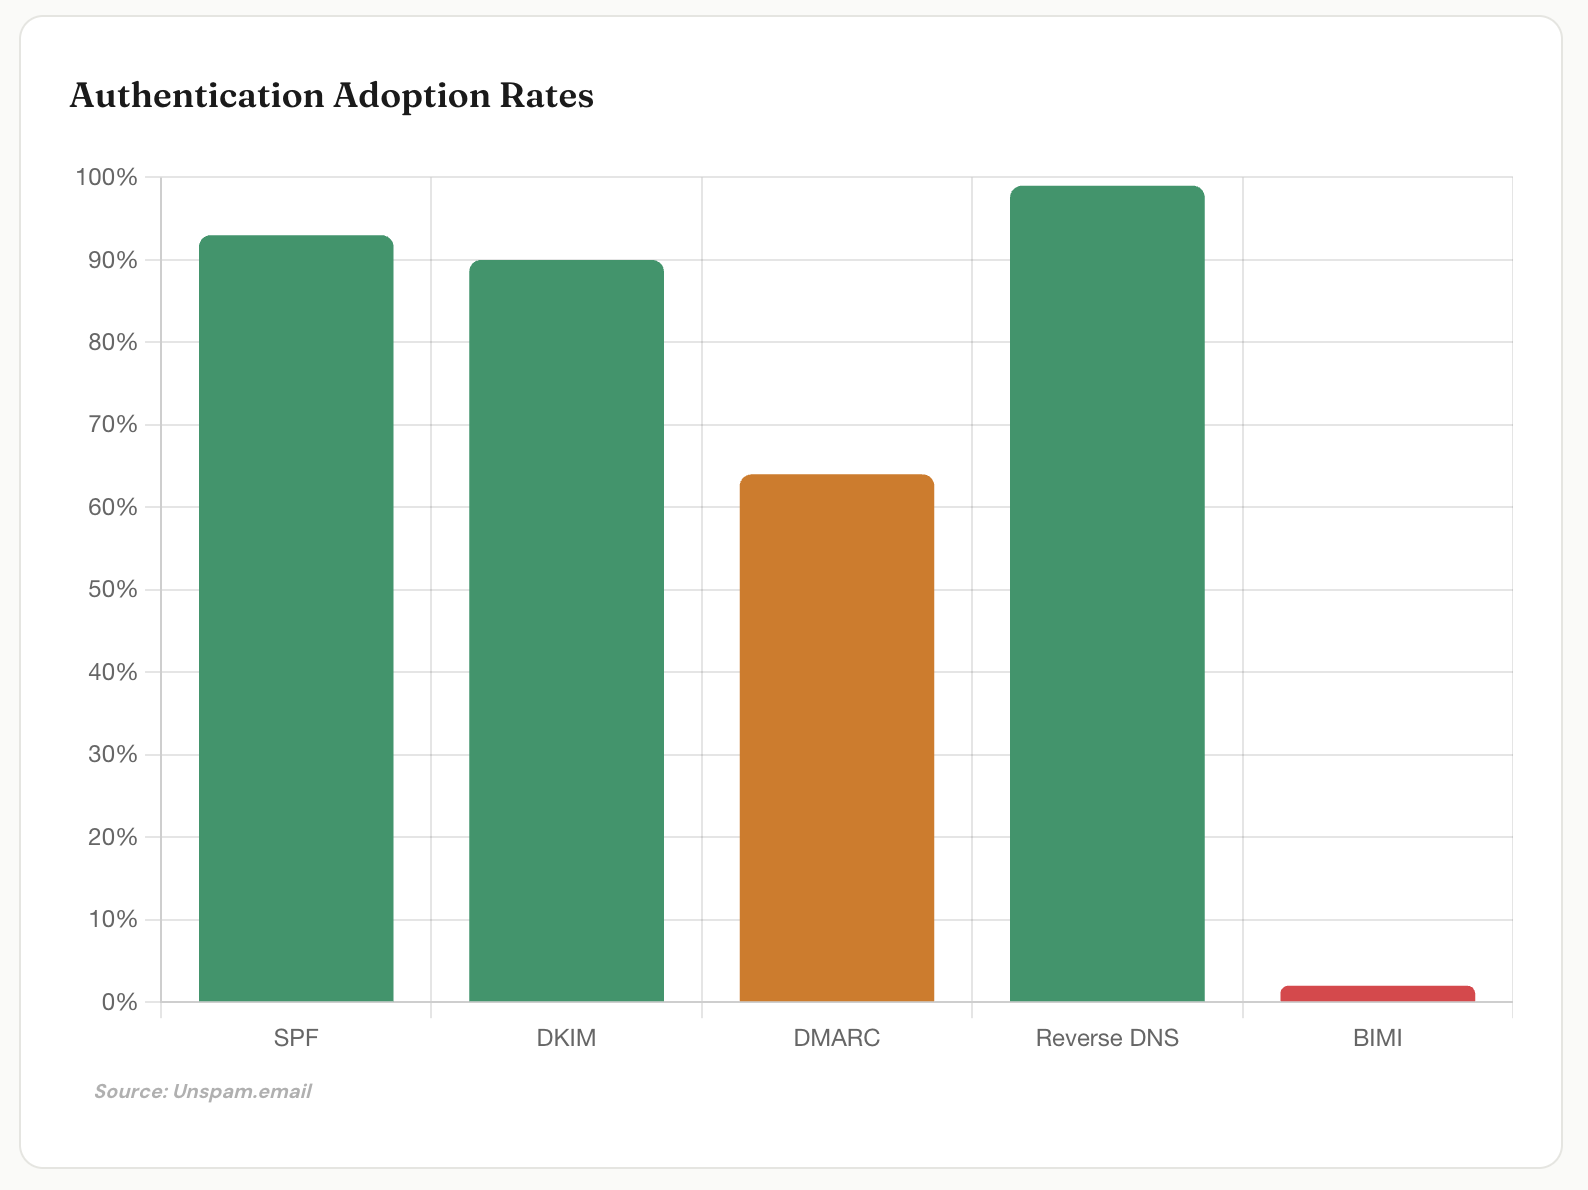
The good news first. SPF adoption hit 90% in 2026. DKIM reached 87%. Reverse DNS is at 98%. These are real, meaningful improvements over the previous year, where our trailing data showed SPF at 88% and DKIM at 84%.
Now the part that matters more: DMARC is stuck at 58%.
Over a third of email-sending domains still have no DMARC policy. Google and Yahoo made DMARC a requirement for bulk senders in February 2024. Gmail tightened enforcement further in November 2025. If you’re still running without DMARC, you’re telling ISPs you haven’t caught up to a standard that’s now two years old. They notice.
For additional context: EasyDMARC’s 2025 adoption report found that global DMARC adoption among top domains surged 64% between 2023 and 2025, from 29.1% to 47.7%. Our 58% figure is higher because we measure actual deployment across tested senders, not just DNS presence among top domains. The gap between “has a DMARC record” and “enforces a DMARC policy” remains significant.
Mailgun’s 2025 State of Email Deliverability report found that 48% of email marketers cite avoiding the spam folder as their biggest challenge. Authentication alone doesn’t solve that problem, but not having it guarantees you’ll face it.
| Protocol | Adoption | What This Means |
|---|---|---|
| SPF | 90% | Strong and growing. The 10% without it face near-automatic filtering at Gmail and Yahoo. |
| DKIM | 87% | Up 6 points year-over-year. Requires more technical effort than SPF (key management, DNS). |
| DMARC | 58% | The biggest gap. 42% of senders remain exposed and unprotected. |
| BIMI | 1% | Barely exists. Requires DMARC enforcement + VMC ($1,500+/year). |
| Reverse DNS | 98% | Basically universal. Missing it gets you rejected outright. |
SPF and DKIM are no longer differentiators. When 90%+ of senders have them, they’re just table stakes. The real question ISPs ask now is whether you have DMARC enforcement, whether your subscribers actually open your emails, and whether your content passes their increasingly aggressive filters.
The Check-by-Check Breakdown
Every email we test goes through 16+ discrete checks. Here’s the full picture, sorted from best to worst:
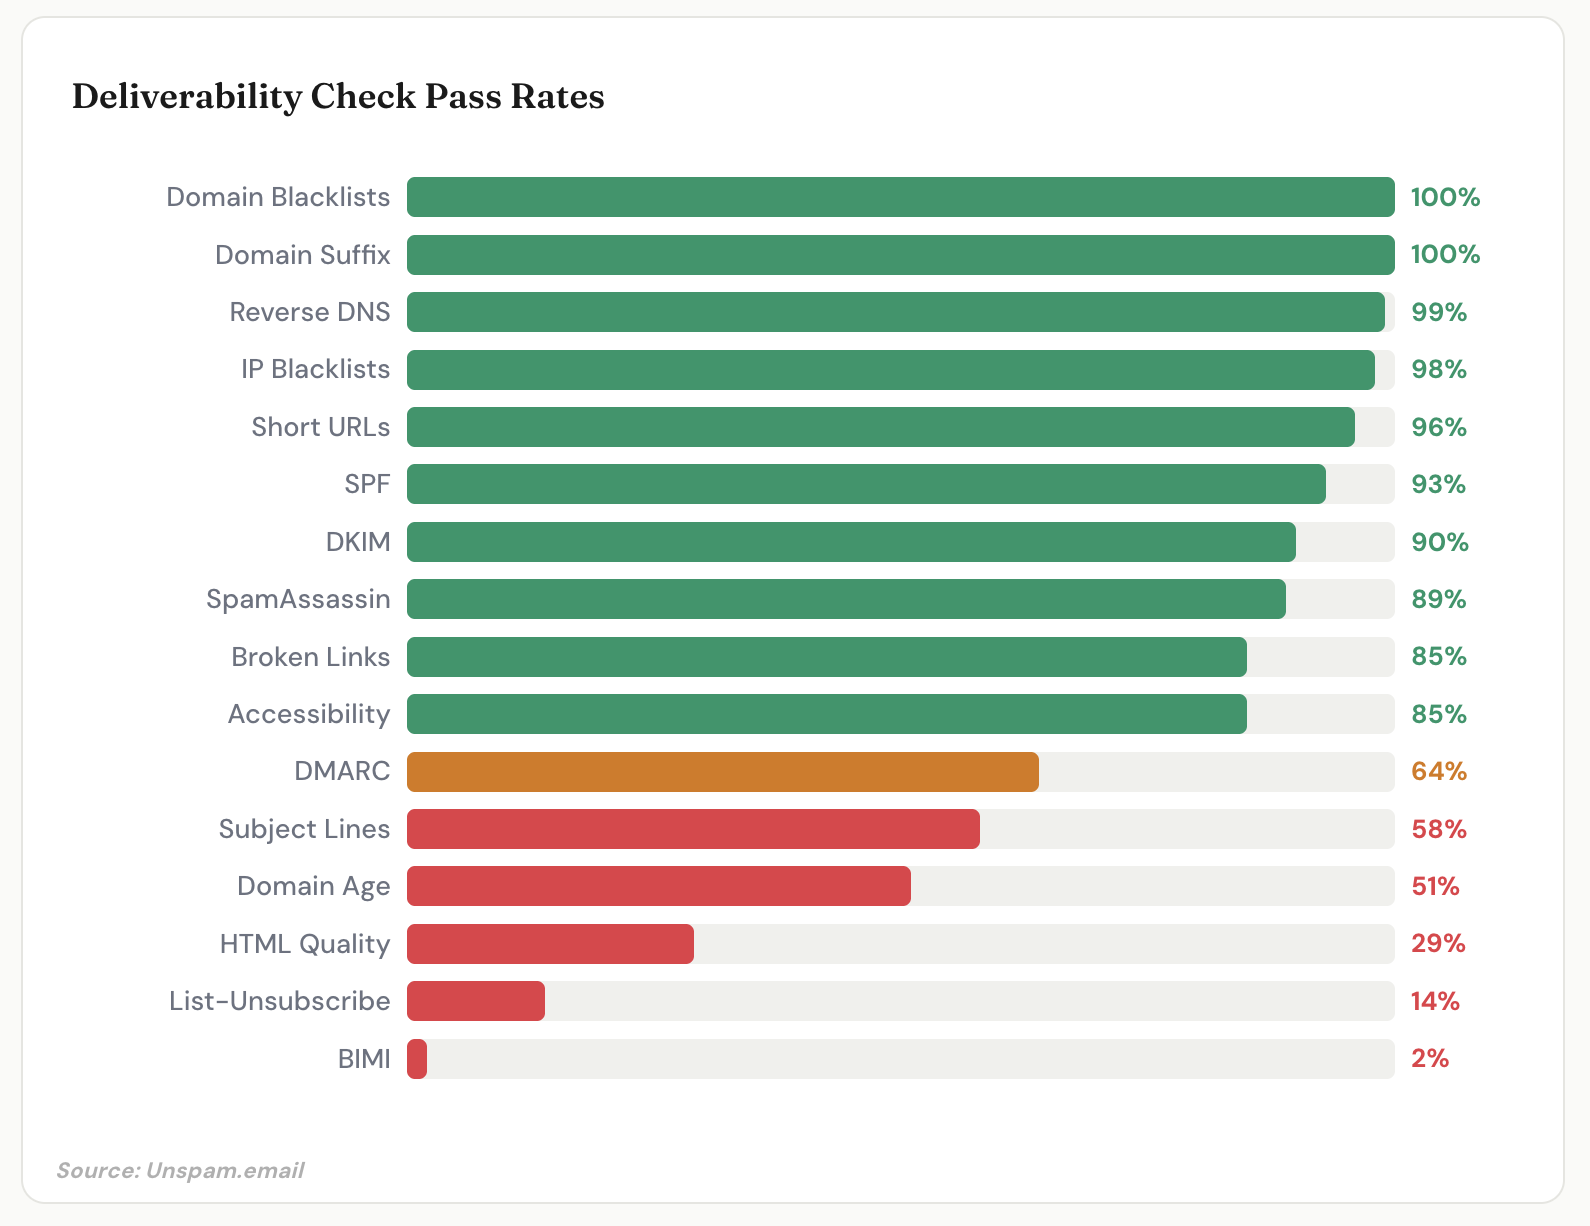
| Check | Pass Rate | What You Should Know |
|---|---|---|
| Domain Blacklists | 99.7% | Only about 0.28% of tested domains carry a listing, but a listing is a strong negative signal. |
| Domain Suffix Reputation | 100% | Your TLD matters. .com accounts for 51.81% of tested domains. |
| Reverse DNS | 98% | Missing this gets you rejected outright. |
| IP Blacklists | 97% | The 3% listed face devastating deliverability drops. |
| Short URL Avoidance | 96% | Don’t use bit.ly or similar shorteners in emails. |
| SPF Records | 90% | Up 5 points year-over-year. Good trajectory. |
| DKIM Signatures | 87% | Up 6 points. Solid improvement. |
| SpamAssassin Content | 89% | 11% of emails have content that triggers spam patterns. |
| Broken Links | 78% | 22% contain dead links. Each one hurts engagement and reputation. |
| Accessibility | 84% | 16% fail, usually for invisible or low-contrast text. What readers can’t see, they can’t click. |
| DMARC Policies | 58% | 42% of senders are unprotected. |
| Subject Line Quality | 56% | 44% of subjects trigger spam analysis flags. |
| Domain Age | 50% | Half of domains are too new for full ISP trust. |
| HTML Best Practices | 30% | 70% fail basic HTML validation. This directly affects filtering. |
| List-Unsubscribe | 14% | 86% missing. The worst stat in this entire benchmark. |
| BIMI Records | 1% | Barely exists at scale. |
Three of those checks deserve a closer look because they’re both terrible and fixable.
List-Unsubscribe at 14%
This one frustrates me the most. 86% of tested emails are missing a List-Unsubscribe header. That’s the one-click unsubscribe mechanism that Gmail and Yahoo now require for bulk senders. Without it, people who want off your list have one option: the spam button. Every spam button click tanks your reputation.
Mailgun’s research found that 48% of email marketers say avoiding the spam folder is their biggest challenge. And yet 86% of them aren’t implementing the single easiest fix. The irony is hard to overstate. The fix takes about 10 minutes in most ESPs.
HTML Quality at 30%
Seven out of ten emails fail basic HTML validation. Malformed tags. Missing doctypes. Broken inline CSS. Our 2025 annual report found that 74% of emails contained structural issues including invalid nesting, missing attributes, and accessibility violations. The 2026 number (70%) represents only a marginal improvement.
This isn’t just about rendering. Poorly structured HTML triggers parsing-based spam filters. Your beautiful campaign template might be getting you flagged.
Subject Lines at 56%
44% of subject lines trip at least minor spam flags. The usual offenders: aggressive urgency language (“Act Now,” “100% Free,” “Urgent”), ALL CAPS (2% of emails), emoji overuse (3%), and lines over 60 characters (8%). Short, clear subjects correlate with better inbox placement. The data on this is extremely consistent.
SpamAssassin Score Distribution
SpamAssassin is still one of the most widely deployed content-level filters. Here’s the 2026 distribution:
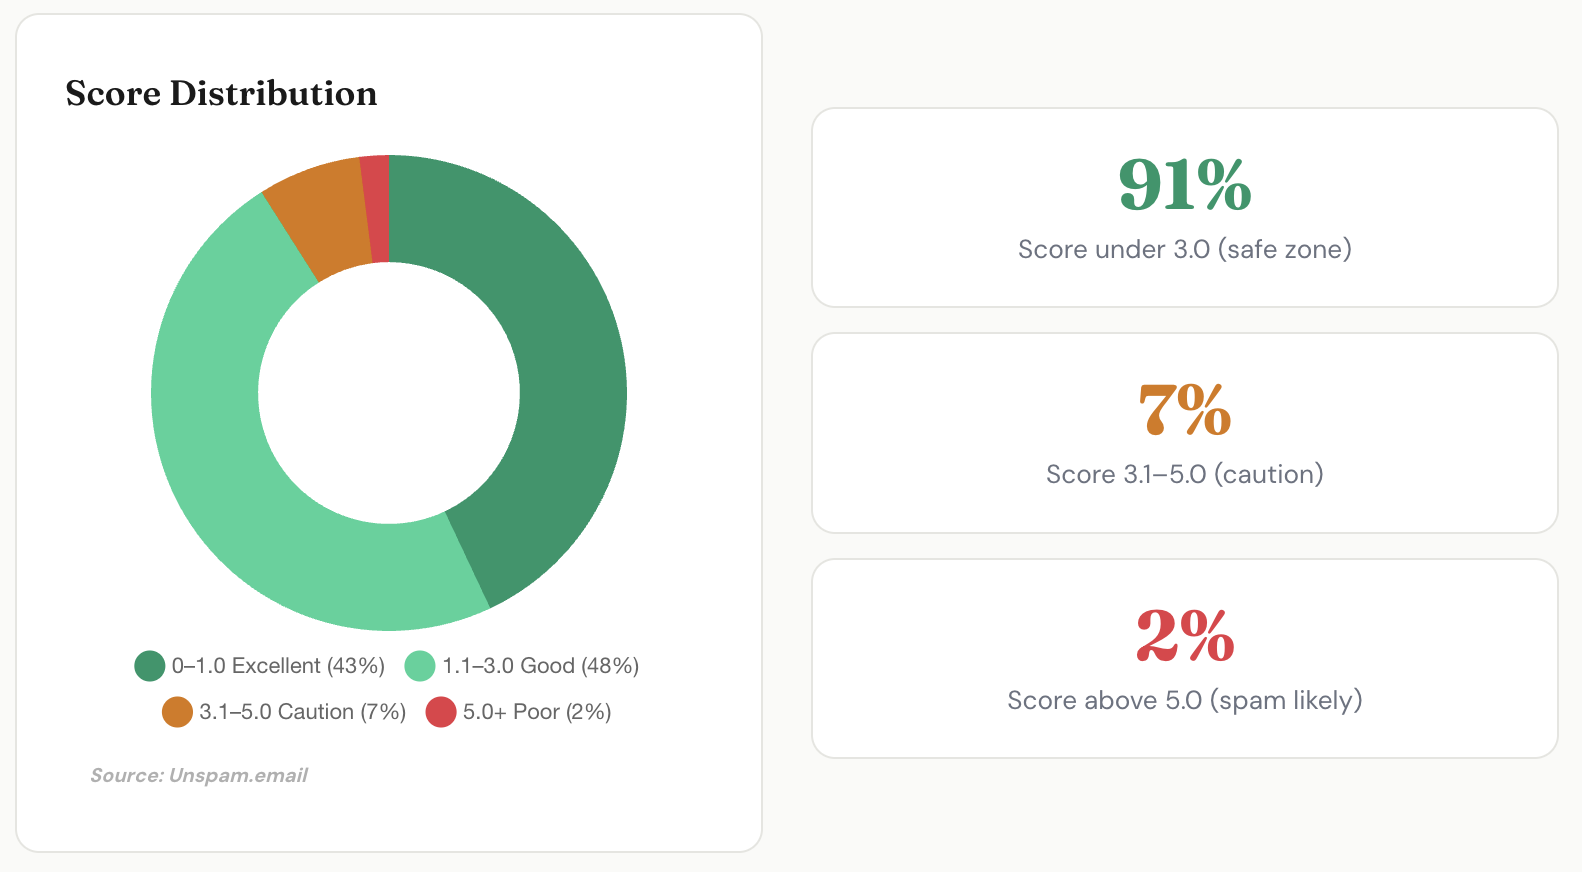
| Score | Rating | % of Emails | What Happens |
|---|---|---|---|
| 0.0 to 1.0 | Excellent | 45% | Inbox. Clean, no flags. |
| 1.1 to 3.0 | Good | 44% | Inbox. Minor issues, nothing triggering. |
| 3.1 to 5.0 | Caution | 8% | Filtering starts here. |
| 5.1 to 10.0 | Poor | 3% | Probably spam folder. |
| 10.0+ | Critical | 0.13% | Blocked. |
89% score under 3.0, the general safe zone. The 11% above that are in trouble. If you’re not testing your SpamAssassin score before sending, you’re flying blind. For what each score band means and how to lower a high score, read the full SpamAssassin score guide.
Email Deliverability by Industry
We segment our data by industry. The results are revealing.
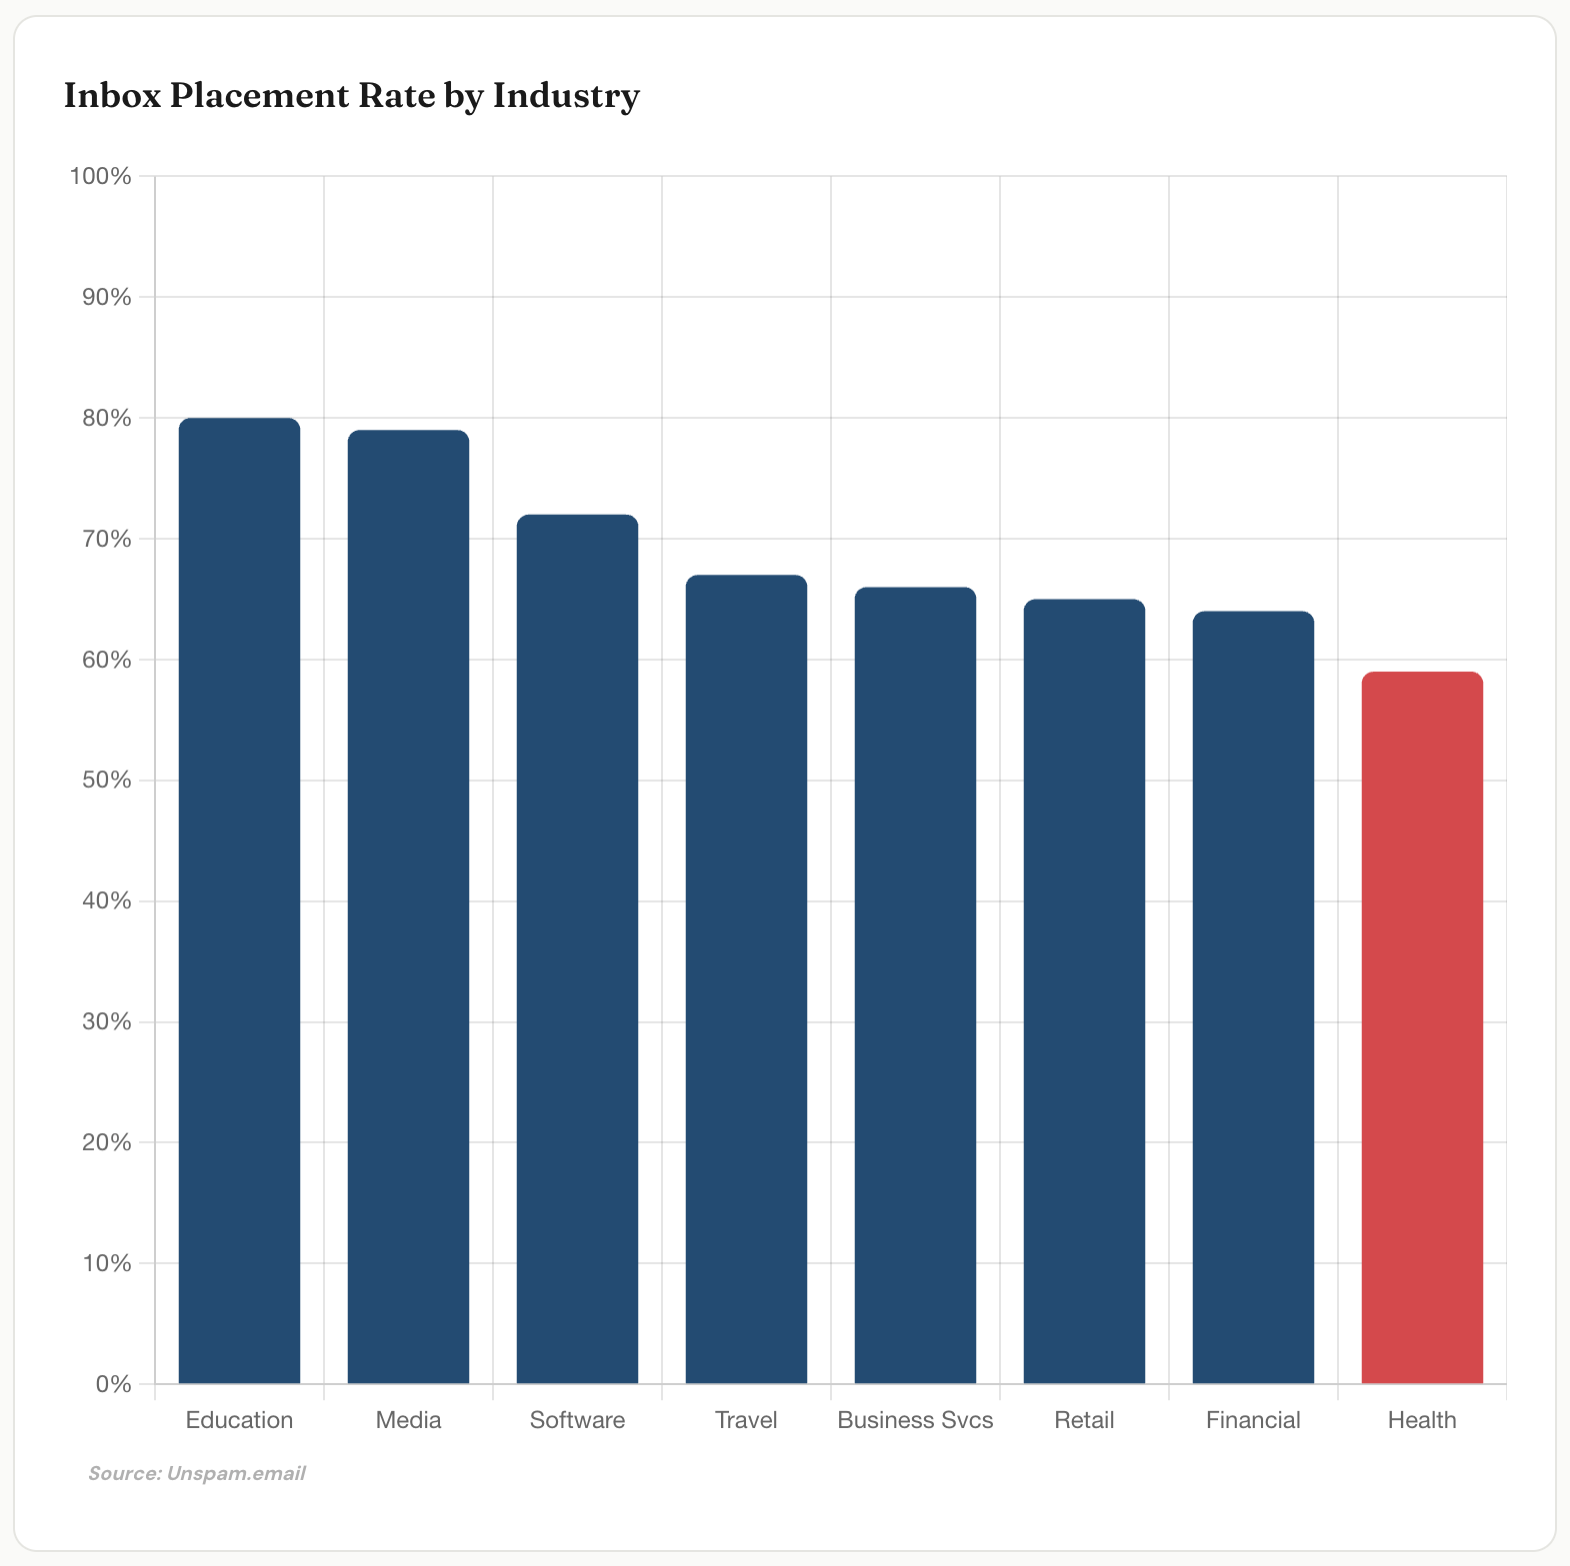
| Industry | Inbox Rate | Health Score | What Stands Out |
|---|---|---|---|
| Health & Wellness | 73% | 87.7 | Best inbox placement; Top Quartile (±6% seasonal) |
| Travel & Hospitality | 72% | 86.3 | Strong placement despite the lowest health score (±10% seasonal) |
| Education | 71% | 87.6 | Above Average (±8% seasonal) |
| Software & Tech | 70% | 87.5 | Average; steady (±4% seasonal) |
| Business Services | 66% | 87.6 | Above Average (±4% seasonal) |
| Media & Publishing | 65% | 87.7 | Top Quartile setup, right at global average (±4% seasonal) |
| Retail & E-commerce | 63% | 87.0 | Below Average placement (±7% seasonal) |
| Financial Services | 63% | 87.0 | Below Average; most stable (±2% seasonal) |
What catches my eye is how little the health scores explain. Across all eight industries the compliance scores cluster in a tight band, from 86.3 (Travel & Hospitality) to 87.7 (Health & Wellness, Media & Publishing). Barely 1.4 points separate the best-set-up industry from the worst. Inbox placement, by contrast, ranges from 63% to 73%, a spread more than seven times wider. The technical setup is essentially solved everywhere; what reaches the inbox is not.
And the two no longer track each other. Health & Wellness now leads inbox placement at 73%, and Travel & Hospitality is right behind at 72% despite having the lowest health score of any sector (86.3). Meanwhile Retail & E-commerce and Financial Services sit at the bottom (63%) even though their compliance scores (87.0) are within a rounding error of everyone else’s. Same authentication, same infrastructure hygiene, ten-point swing in placement. The old assumption that a stronger technical setup buys you the inbox simply doesn’t hold in this data.
If health score doesn’t predict placement, what does? Engagement and content intent. Health & Wellness and Education (71%) tend to send wanted, transactional, low-promotional mail that subscribers actually open. Retail and Financial lean heavily on promotional sends and recurring offers, which ISPs scrutinize harder regardless of how clean the DNS records are. The volatility column reinforces this: Travel swings ±10% seasonally and Education ±8%, both tied to booking and enrollment cycles, while Financial Services is the most stable at ±2%.
For context on the broader email marketing picture: Litmus found that email marketing generates between 10x and 50x ROI for 65% of programs. The average ROI sits between $36 and $42 for every $1 spent. Those returns only materialize when emails actually reach the inbox. At a 59% global inbox rate, more than a third of that potential ROI is being left on the table.
Regulatory Compliance (It’s Worse Than You Think)
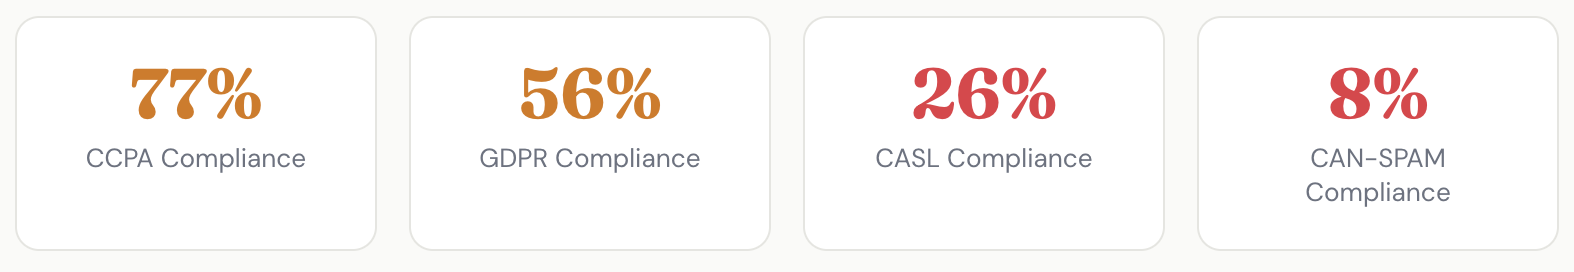
CCPA compliance is at 81%, the best of the bunch. GDPR sits at 62%, which is alarming given the fines involved. CASL is at 37%. And CAN-SPAM compliance is at 19%. Nineteen percent. For the primary anti-spam regulation in a country that sends 9.7 billion emails per day. Most senders either don’t understand what’s required or assume nobody’s watching. That’s a risky assumption.
BIMI: The Brand Feature Almost Nobody Uses
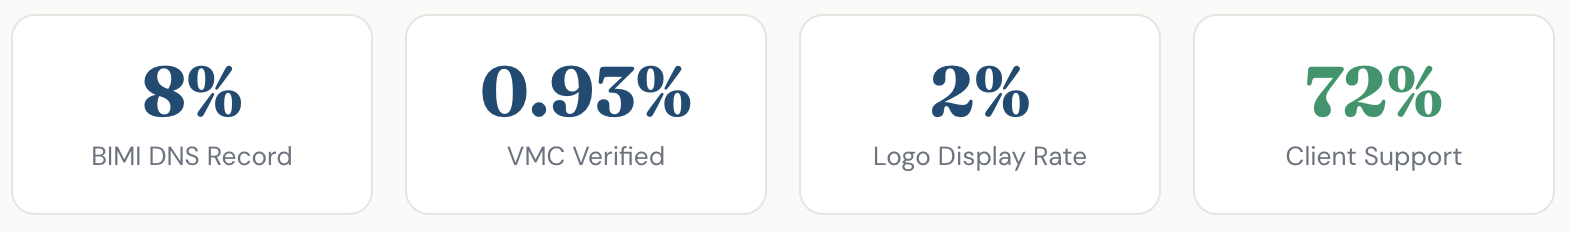
BIMI lets you show your verified brand logo next to your emails in the inbox. Gmail supports it. Apple Mail supports it. 72% of email clients do. The results are clear: +25% brand recognition, +18% open rates for VMC-verified logos, +32% trust scores.
And almost nobody has implemented it.
1% of domains have a BIMI DNS record. Only 0.93% have a Verified Mark Certificate. The actual logo display rate across the tested emails is 1%.
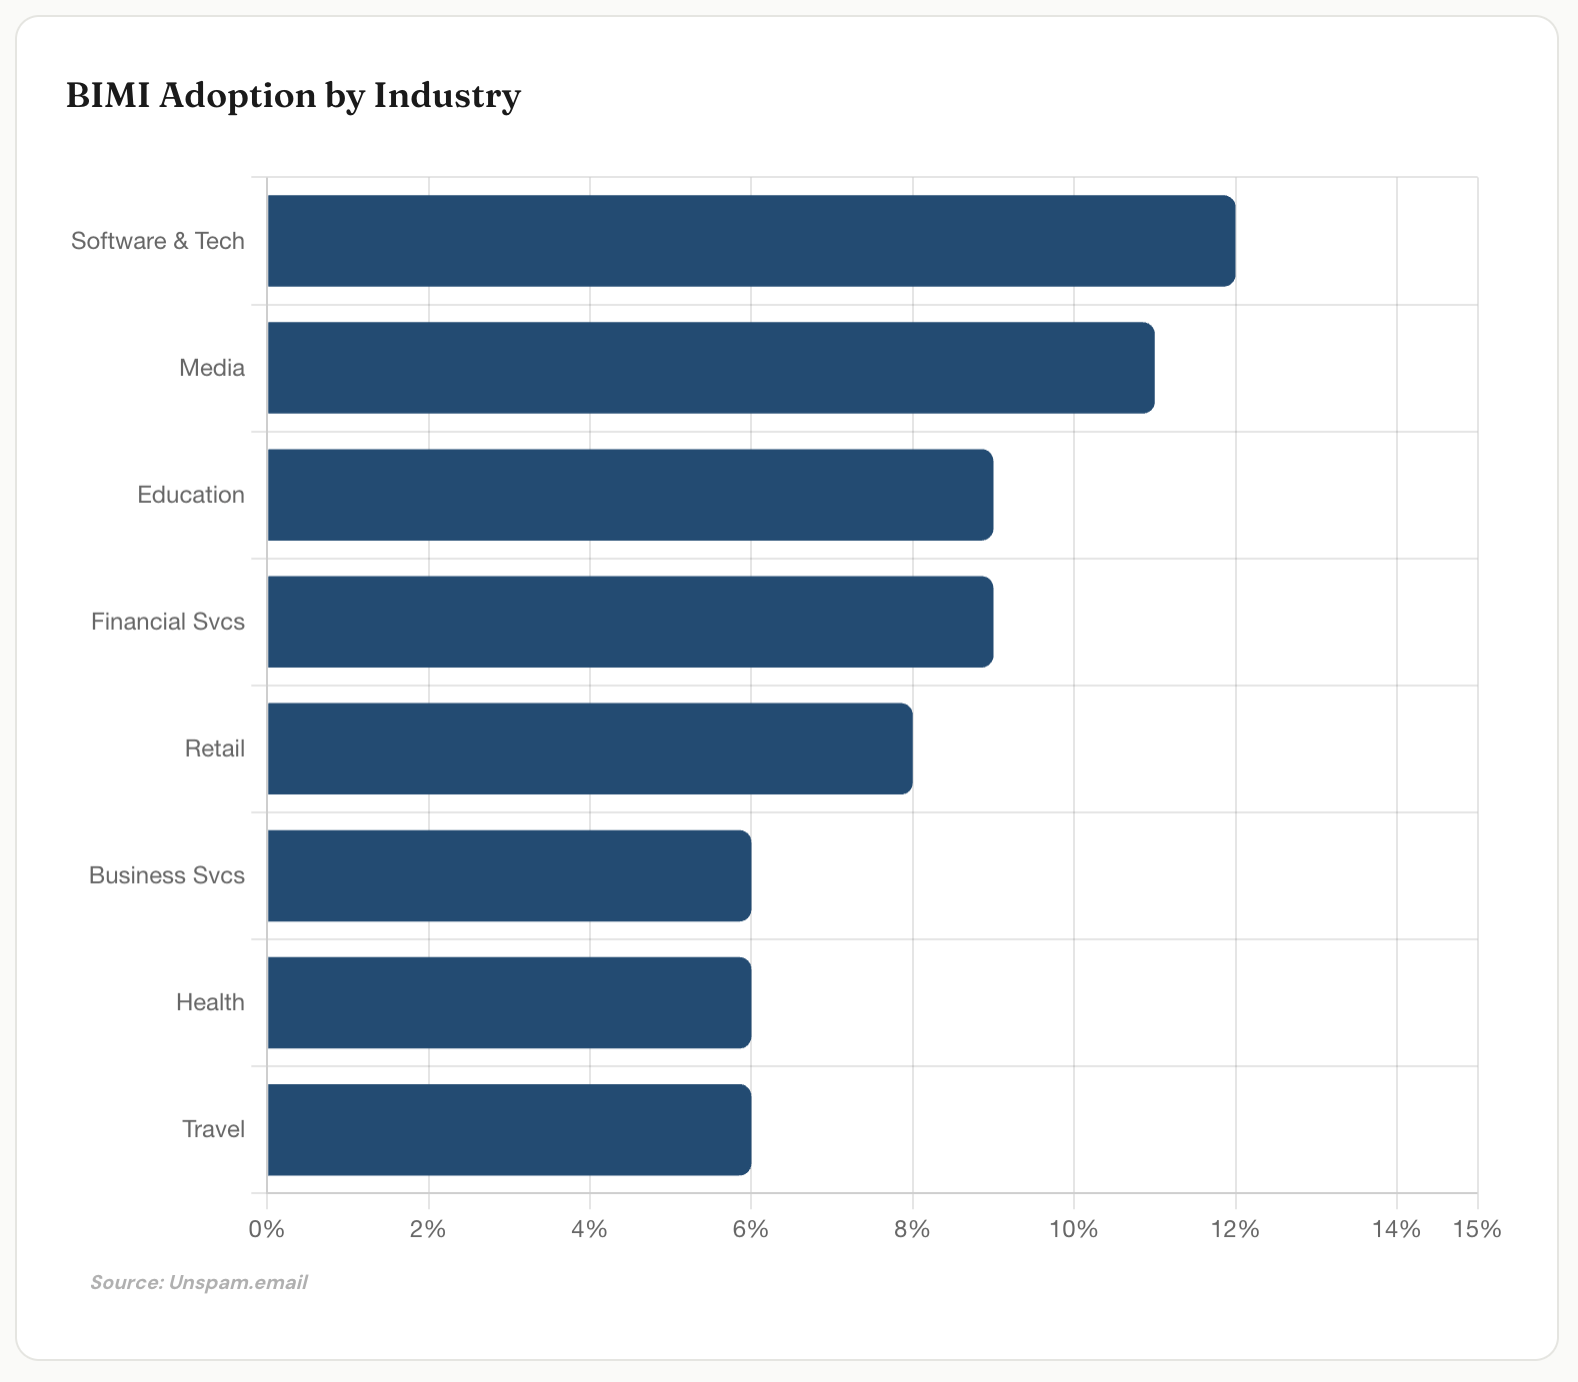
BIMI Adoption by Industry
| Industry | Adoption | Context |
|---|---|---|
| Software & Technology | 12% | Highest. Technical teams drive faster adoption. |
| Media & Publishing | 11% | Brand differentiation is a competitive priority. |
| Education | 9% | Budget constraints slow VMC investment. |
| Financial Services | 9% | Anti-phishing and trust are critical use cases. |
| Retail & E-commerce | 8% | Visual branding directly impacts purchase decisions. |
| Business Services | 6% | B2B focus means slower adoption curve. |
| Health & Wellness | 6% | Credibility matters for patient communication. |
| Travel & Hospitality | 6% | Strong branding influences booking decisions. |
The barriers are real. You need DMARC enforcement first (which 42% of senders don’t have), plus a VMC costing $1,500+ annually. But for consumer brands where inbox trust directly drives revenue, the math works. Early adopters are seeing measurable results.
Inbox Placement & Deliverability (Unspam 2026 Benchmark)
- 59% global inbox placement rate. 34% of emails land in spam. 7% sorted into tabs.
- 87/100 global deliverability health score (rated Excellent).
- 82% of all deliverability checks pass (OK status), 14% warn, 4% fail critically.
- Yahoo has the lowest inbox rate: 40%. About 60% of emails to Yahoo land in spam.
- Outlook sends 52% of tested emails to spam. Only 48% reach the inbox.
- Gmail delivers 68% to the inbox, with 82% of inbox-placed Gmail emails landing in the Primary tab.
- Amazon WorkMail (100%) and ProtonMail (95%) deliver the highest inbox rates.
Authentication Adoption (Unspam 2026 Benchmark)
- 90% SPF adoption (up from 88% year-over-year).
- 87% DKIM adoption (up from 84%).
- 58% DMARC adoption. 42% of senders remain unprotected.
- 1% BIMI adoption. Only 0.93% have VMC-verified logos.
- 98% Reverse DNS adoption.
Content Quality (Unspam 2026 Benchmark)
- 14% List-Unsubscribe compliance. 86% of emails miss this required header.
- 30% HTML best practices pass rate. 70% of emails fail basic HTML validation.
- 56% subject line quality pass rate. 44% trigger spam analysis flags.
- 78% broken link clean rate. 22% of emails contain at least one dead link.
- 84% accessibility compliance. 16% of images missing alt text.
- 50% domain age pass rate. Half of the tested domains are too new for full ISP trust.
All Unspam Benchmark statistics are from the Unspam.email Deliverability Benchmark, 2026 (daily-updated data from thousands of tests across 195+ countries). Please credit Unspam.email when referencing this data.
What You Should Actually Do About All This
If I were looking at these numbers for my own email program, here’s what I’d do, in order of impact relative to effort:
- Add List-Unsubscribe headers. 86% of emails are missing them. It takes minutes to set up. Gmail and Yahoo require it. This single change reduces spam complaints faster than anything else.
- Set up DMARC with enforcement. Move to p=quarantine or p=reject. 42% of senders still don’t have DMARC. ISPs are penalizing you for it.
- Fix your HTML templates. 30% pass rate. Run them through a validator. Fix the broken tags and missing doctypes. Do it once.
- Clean up subject lines. 44% raise flags. Drop the urgency language. Lose the ALL CAPS. Keep it under 60 characters. Test before you ship.
- Check links before every send. 22% broken link rate. Automate this.
- Segment by provider. If your audience uses Outlook (48% inbox) or Yahoo (40% inbox), you need dedicated strategies per ISP.
- Test SpamAssassin scores. 11% of emails score above 3.0. If yours do, you’re losing placement.
- Consider BIMI if you’re a consumer brand. 72% client support. Real engagement lifts. The cost is real, but so is the return.
The Bigger Picture
Authentication is climbing and it’s still not enough. SPF and DKIM are at 90%+. Inbox placement is at 59%. That gap is about engagement signals. ISPs now layer behavioral data (opens, clicks, replies) on top of technical checks. Perfect authentication with poor engagement still gets you filtered.
The provider gap is widening. 60 points between Amazon WorkMail (100%) and Yahoo (40%). Treating deliverability as a single number is increasingly pointless.
Content quality is the frontier nobody’s working on. List-Unsubscribe at 14%. HTML at 30%. Subject quality at 56%. All fixable. Most of them quickly. The fact that these numbers haven’t moved much suggests senders just aren’t testing their content before sending.
Regulatory exposure is building quietly. CAN-SPAM at 19%. GDPR at 62%. That’s legal risk hiding in plain sight.
Methodology
This analysis uses data from Unspam.email Deliverability Benchmark. We aggregate and anonymize results from thousands of daily tests across major ESPs, enterprise senders, and monitoring platforms in 195+ countries.
The interactive dashboard lets you filter by time period, provider, and industry. For a personalized email deliverability audit, talk to our email deliverability consultants.
